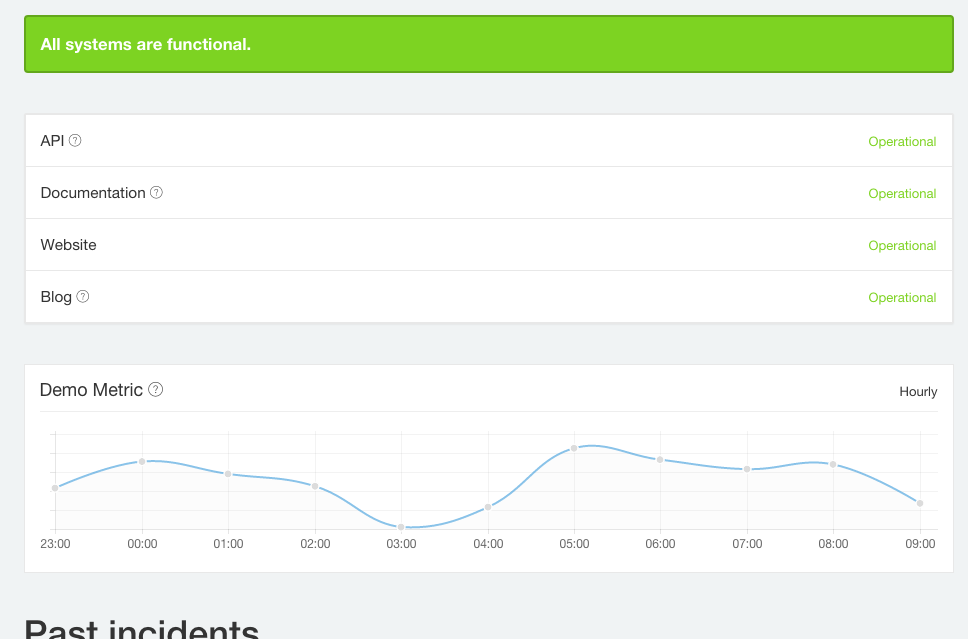
Cachet seems to be one of the better open source status page solution with nice visuals and powerful REST APIs.
Cachet works very nicely and easily on Docker. Below are the steps to set it up on EC2.
EC2 Preparation
- Launch an instance
- Connect to the instance
- Get Docker running
“To install Docker on an Amazon Linux instance”
Remember to log out and back in after setting permission!
Getting Cachet on Docker
- Run “Quickstart with Docker” steps on https://github.com/cachethq/cachet which includes:
- Run DB container (MySQL)
- Initialize DB
- Run Cachet container
From the command
$ docker run -d --name cachet --link mysql:mysql -p 80:8000 -e DB_HOST=mysql -e DB_DATABASE=$DB_DATABASE -e DB_USERNAME=$DB_USERNAME -e DB_PASSWORD=$DB_PASSWORD cachethq/cachet:latest
Notice that this command by default setup port mapping to 80 – you should make sure the proper security policy is set in EC2 to allow remote access
Setting up Cachet
Cachet has a nice setup wizard, simply open your EC2 {instance IP} on a browser – you should be redirected to the setup page. On that page choose database for driver and then complete the rest of the setup steps.
To come back to configuration, when the page is opened, go down and find the dashboard button and sign in for more options.
To get API key, click the logo on top left and profile.
REST with Cachet
Create component
curl -H "Content-Type: application/json;" -H "X-Cachet-Token: YOUR_TOKEN" -d '{"name":"My component","description":"description of the component, it supports *markdown*","status":1}' http:// {instance IP}/api/v1/components
Create metrics for component
curl -H "Content-Type: application/json;" -H "X-Cachet-Token: YOUR_TOKEN" -d '{"name":"Queue length","description":"queue length","suffix":" items (this is the unit, notice the prefix space)","default_value":"0","display_chart":1}' http:// {instance IP}/api/v1/metrics
Return JSON result like this
{"data":{"name":"Queue length","display_chart":"1","default_value":"0","calc_type":0,"description":"queue length","suffix":" items","updated_at":"2015-06-23 23:19:19","created_at":"2015-06-23 23:19:19","id":1}}
Notice id:1 for the created metrics
Post metrics data point
We will reference the metrics with id 1; set timestamp to UNIX Epoch time.
curl -H "Content-Type: application/json;" -H "X-Cachet-Token: YOUR_TOKEN" -d '{"value":30,"timestamp":1435089600}' http:// {instance IP}/api/v1/metrics/1/points

curl -H "Content-Type: application/json;" -H "X-Cachet-Token: YOUR_TOKEN" -d '{"value":45,"timestamp":1435093380}' http:// {instance IP}/api/v1/metrics/1/points
Lastly you can your metrics here http:// {instance IP}/dashboard/metrics
And change how the posted data points are represented, either as Sum (ie. Add all reported data points within the time range) or Average