Spark

Aggregating time-series with Spark DataFrame

First, for this test, we will make up a DataFrame
(examples are in Python)

from pyspark.sql.functions import *

# Create a simple DataFrame.
data = [
('a', '2', '2016-01-02 00:01:02'),
('a', '4', '2016-01-02 00:01:03'),
('b', '1', '2016-01-02 23:59:50'),
('b', '2', '2016-01-02 23:59:59'),
('b', '3', '2016-01-02 23:59:59')]
df = sqlContext.createDataFrame(data, ['team', 'total_score', 'window_start'])

df = df.select(
df.team,
df.total_score.cast('integer'),
df.window_start.cast('timestamp'))

A naive approach would be to simply truncate the timestamp to the minute (notice no rounding up here!)

result = \
df.select('*', date_format('window_start', 'yyyy-MM-dd hh:mm').alias('time_window')) \
.groupby('time_window') \
.agg({'total_score': 'sum'})
result.show()

+----------------+----------------+
|     time_window|sum(total_score)|
+----------------+----------------+
|2016-01-02 12:01|               6|
|2016-01-02 11:59|               6|
+----------------+----------------+

# Alternatively, this has the same effect

result = \
df.withColumn('time_window', date_format('window_start', 'yyyy-MM-dd hh:mm')) \
.groupby('time_window') \
.agg({'total_score': 'sum'})
result.show()

+----------------+----------------+
|     time_window|sum(total_score)|
+----------------+----------------+
|2016-01-02 12:01|               6|
|2016-01-02 11:59|               6|
+----------------+----------------+

It could also be calculated (still truncating!)

result = \
df.selectExpr('total_score', 'cast(unix_timestamp(window_start) / 60 as int) * 60 as time_window') \
.groupby('time_window') \
.agg({'total_score': 'sum'})
result.show()

+-----------+----------------+
|time_window|sum(total_score)|
+-----------+----------------+
| 1451692860|               6|
| 1451779140|               6|
+-----------+----------------+

result = \
df.withColumn('time_window', (unix_timestamp('window_start') / 60).cast('int') * 60) \
.groupby('time_window') \
.agg({'total_score': 'sum'})
result.show()

+-----------+----------------+
|time_window|sum(total_score)|
+-----------+----------------+
| 1451692860|               6|
| 1451779140|               6|
+-----------+----------------+

Perhaps a more elegant way is to use Spark window functions.
Before we start we would need to add a column of numeric values for orderBy

df = df.select(
df.team,
df.total_score.cast('integer'),
df.window_start.cast('timestamp'),
df.window_start.cast('integer').alias('window_start_int'))

from pyspark.sql.window import Window

window_spec = \
Window.partitionBy(df['team']) \
.orderBy(df['window_start_int']) \
.rangeBetween(-60, 60)

So now this is saying
1. partition by ‘team’
2. order by timestamp (as int)
3. ‘RANGE BETWEEN 60 PRECEDING AND 60 FOLLOWING’

What is nice about this is we can create a new column by aggregating over the window specification, and comparing it to existing column values, like so:

Make sure you add an alias for sum_score_over_time otherwise the default name is kinda long

sum_score_over_time = \
sum(df['total_score']).over(window_spec)
result = df.select(
df['window_start_int'],
df['total_score'].alias('score'),
sum_score_over_time.alias('total_score_in_time_window'),
(df['total_score']/sum_score_over_time*100).alias('pct_score'))
result.show()

+----------------+-----+--------------------------+------------------+
|window_start_int|score|total_score_in_time_window|         pct_score|
+----------------+-----+--------------------------+------------------+
|      1451779190|    1|                         6|16.666666666666664|
|      1451779199|    2|                         6| 33.33333333333333|
|      1451779199|    3|                         6|              50.0|
|      1451692862|    2|                         6| 33.33333333333333|
|      1451692863|    4|                         6| 66.66666666666666|
+----------------+-----+--------------------------+------------------+
operational

Running Apache Spark and Zeppelin on Google Cloud

Google Cloud Dataproc is a managed Hadoop MapReduce, Spark, Pig, and Hive service on Google Cloud Platform. I want to get Apache Zeppelin running on Google Cloud and here is what I have gone through.

I see that there is a tutorial on getting Jupyter on Dataproc, so I’d start with that:

Setup a new project

https://cloud.google.com/dataproc/tutorials/jupyter-notebook#set_up_your_project

Create a storage bucket

https://cloud.google.com/dataproc/tutorials/jupyter-notebook#create_a_cloud_storage_bucket_in_your_project

Prepare initialization actions script

There is actually an initialization actions script for Apache Zeppelin on GitHub, made available by Google. This script automatically sets up Zeppelin to use Spark on the Dataproc cluster.

To use, download the script file from GitHub (raw), and then upload to the storage bucket created in the last step.

gsutil cp zeppelin.sh gs://<bucket-name>/

remember to run gcloud init first

Create a cluster

There are multiple ways to create a cluster. Aside from calling the REST API, one could:
a) create cluster from Create a Cloud Dataproc cluster page

b) or from command line

you can get the command line equivalent from (a) to script this in the future – click ‘command line’ below the ‘Create’ button

It might look something like this

gcloud beta dataproc clusters create cluster-1 \
--zone us-central1-c --master-machine-type n1-standard-2 \
--master-boot-disk-size 500 --num-workers 2 \
--worker-machine-type n1-standard-2 \
--worker-boot-disk-size 500 --image-version 0.2 \
--project <project-name> \
--initialization-actions 'gs://<bucket-name>/zeppelin.sh'

(image-version 0.2 has Spark 1.5.2 – see here for the full list)

Now wait a bit for the cluster – this should take a while since the current script is cloning Apache Zeppelin source code and building it.

to check how things are looking, go to the new cluster on Cloud Platform Console, then on ‘VM instances’ tab, you should see ‘SSH’ next to your master node.

And on SSH, you should see something like this in /usr/lib:

user@cluster-1-m:/usr/lib$ ls
drwxr-xr-x 11 root root 4096 Jan 31 22:42 incubator-zeppelin

Connect to Apache Zeppelin

SSH Tunnel

Now to connect to the notebook on a browser, first create an SSH tunnel:

gcloud compute ssh --zone=<cluster-zone> \
--ssh-flag="-D 1080" --ssh-flag="-N" --ssh-flag="-n" <master-node-hostname>

master node hostname should be cluster-1-m if created as above

This sets up a proxy server at port 1080 on your machine, and will keep running until it is aborted.

Next open a browser to connect through the proxy server, to do that, from a separate terminal window, run:

/Applications/Google\ Chrome.app/Contents/MacOS/Google\ Chrome \
--proxy-server="socks5://localhost:1080" \
--host-resolver-rules="MAP * 0.0.0.0 , EXCLUDE localhost" \
--user-data-dir=/tmp/

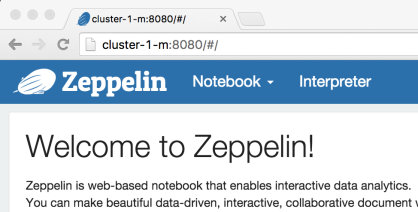
Type this address in the new browser instance to connect to Zeppelin on your Dataproc cluster:
http://cluster-1-m:8080
z

Open port

Alternatively, to open a port with an external address on the firewall (note: this is not advisable unless for testing):

  • Open VM Instances, check master, in this case cluster-1-m
  • Edit
  • in tag, add a tag name master
  • in External IP, pick an new name – and then note down the IP
  • run this to create the firewall rule (this can be done similarly on Cloud Platform Console) – where 8080 is the default port for Zeppelin
gcloud compute firewall-rules create zeppelin \
--source-ranges 0.0.0.0/0 --allow tcp:8080 \
--target-tags master

(see open-gce-firewall)

Then in any browser, type this for address:
http://‹master-node-external-IP›:8080