Spark

Aggregating time-series with Spark DataFrame

First, for this test, we will make up a DataFrame
(examples are in Python)

from pyspark.sql.functions import *

# Create a simple DataFrame.
data = [
('a', '2', '2016-01-02 00:01:02'),
('a', '4', '2016-01-02 00:01:03'),
('b', '1', '2016-01-02 23:59:50'),
('b', '2', '2016-01-02 23:59:59'),
('b', '3', '2016-01-02 23:59:59')]
df = sqlContext.createDataFrame(data, ['team', 'total_score', 'window_start'])

df = df.select(
df.team,
df.total_score.cast('integer'),
df.window_start.cast('timestamp'))

A naive approach would be to simply truncate the timestamp to the minute (notice no rounding up here!)

result = \
df.select('*', date_format('window_start', 'yyyy-MM-dd hh:mm').alias('time_window')) \
.groupby('time_window') \
.agg({'total_score': 'sum'})
result.show()

+----------------+----------------+
|     time_window|sum(total_score)|
+----------------+----------------+
|2016-01-02 12:01|               6|
|2016-01-02 11:59|               6|
+----------------+----------------+

# Alternatively, this has the same effect

result = \
df.withColumn('time_window', date_format('window_start', 'yyyy-MM-dd hh:mm')) \
.groupby('time_window') \
.agg({'total_score': 'sum'})
result.show()

+----------------+----------------+
|     time_window|sum(total_score)|
+----------------+----------------+
|2016-01-02 12:01|               6|
|2016-01-02 11:59|               6|
+----------------+----------------+

It could also be calculated (still truncating!)

result = \
df.selectExpr('total_score', 'cast(unix_timestamp(window_start) / 60 as int) * 60 as time_window') \
.groupby('time_window') \
.agg({'total_score': 'sum'})
result.show()

+-----------+----------------+
|time_window|sum(total_score)|
+-----------+----------------+
| 1451692860|               6|
| 1451779140|               6|
+-----------+----------------+

result = \
df.withColumn('time_window', (unix_timestamp('window_start') / 60).cast('int') * 60) \
.groupby('time_window') \
.agg({'total_score': 'sum'})
result.show()

+-----------+----------------+
|time_window|sum(total_score)|
+-----------+----------------+
| 1451692860|               6|
| 1451779140|               6|
+-----------+----------------+

Perhaps a more elegant way is to use Spark window functions.
Before we start we would need to add a column of numeric values for orderBy

df = df.select(
df.team,
df.total_score.cast('integer'),
df.window_start.cast('timestamp'),
df.window_start.cast('integer').alias('window_start_int'))

from pyspark.sql.window import Window

window_spec = \
Window.partitionBy(df['team']) \
.orderBy(df['window_start_int']) \
.rangeBetween(-60, 60)

So now this is saying
1. partition by ‘team’
2. order by timestamp (as int)
3. ‘RANGE BETWEEN 60 PRECEDING AND 60 FOLLOWING’

What is nice about this is we can create a new column by aggregating over the window specification, and comparing it to existing column values, like so:

Make sure you add an alias for sum_score_over_time otherwise the default name is kinda long

sum_score_over_time = \
sum(df['total_score']).over(window_spec)
result = df.select(
df['window_start_int'],
df['total_score'].alias('score'),
sum_score_over_time.alias('total_score_in_time_window'),
(df['total_score']/sum_score_over_time*100).alias('pct_score'))
result.show()

+----------------+-----+--------------------------+------------------+
|window_start_int|score|total_score_in_time_window|         pct_score|
+----------------+-----+--------------------------+------------------+
|      1451779190|    1|                         6|16.666666666666664|
|      1451779199|    2|                         6| 33.33333333333333|
|      1451779199|    3|                         6|              50.0|
|      1451692862|    2|                         6| 33.33333333333333|
|      1451692863|    4|                         6| 66.66666666666666|
+----------------+-----+--------------------------+------------------+
operational

Running Apache Spark and Zeppelin on Google Cloud

Google Cloud Dataproc is a managed Hadoop MapReduce, Spark, Pig, and Hive service on Google Cloud Platform. I want to get Apache Zeppelin running on Google Cloud and here is what I have gone through.

I see that there is a tutorial on getting Jupyter on Dataproc, so I’d start with that:

Setup a new project

https://cloud.google.com/dataproc/tutorials/jupyter-notebook#set_up_your_project

Create a storage bucket

https://cloud.google.com/dataproc/tutorials/jupyter-notebook#create_a_cloud_storage_bucket_in_your_project

Prepare initialization actions script

There is actually an initialization actions script for Apache Zeppelin on GitHub, made available by Google. This script automatically sets up Zeppelin to use Spark on the Dataproc cluster.

To use, download the script file from GitHub (raw), and then upload to the storage bucket created in the last step.

gsutil cp zeppelin.sh gs://<bucket-name>/

remember to run gcloud init first

Create a cluster

There are multiple ways to create a cluster. Aside from calling the REST API, one could:
a) create cluster from Create a Cloud Dataproc cluster page

b) or from command line

you can get the command line equivalent from (a) to script this in the future – click ‘command line’ below the ‘Create’ button

It might look something like this

gcloud beta dataproc clusters create cluster-1 \
--zone us-central1-c --master-machine-type n1-standard-2 \
--master-boot-disk-size 500 --num-workers 2 \
--worker-machine-type n1-standard-2 \
--worker-boot-disk-size 500 --image-version 0.2 \
--project <project-name> \
--initialization-actions 'gs://<bucket-name>/zeppelin.sh'

(image-version 0.2 has Spark 1.5.2 – see here for the full list)

Now wait a bit for the cluster – this should take a while since the current script is cloning Apache Zeppelin source code and building it.

to check how things are looking, go to the new cluster on Cloud Platform Console, then on ‘VM instances’ tab, you should see ‘SSH’ next to your master node.

And on SSH, you should see something like this in /usr/lib:

user@cluster-1-m:/usr/lib$ ls
drwxr-xr-x 11 root root 4096 Jan 31 22:42 incubator-zeppelin

Connect to Apache Zeppelin

SSH Tunnel

Now to connect to the notebook on a browser, first create an SSH tunnel:

gcloud compute ssh --zone=<cluster-zone> \
--ssh-flag="-D 1080" --ssh-flag="-N" --ssh-flag="-n" <master-node-hostname>

master node hostname should be cluster-1-m if created as above

This sets up a proxy server at port 1080 on your machine, and will keep running until it is aborted.

Next open a browser to connect through the proxy server, to do that, from a separate terminal window, run:

/Applications/Google\ Chrome.app/Contents/MacOS/Google\ Chrome \
--proxy-server="socks5://localhost:1080" \
--host-resolver-rules="MAP * 0.0.0.0 , EXCLUDE localhost" \
--user-data-dir=/tmp/

Type this address in the new browser instance to connect to Zeppelin on your Dataproc cluster:
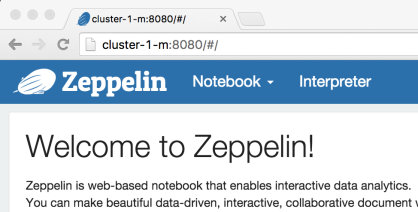
http://cluster-1-m:8080
z

Open port

Alternatively, to open a port with an external address on the firewall (note: this is not advisable unless for testing):

  • Open VM Instances, check master, in this case cluster-1-m
  • Edit
  • in tag, add a tag name master
  • in External IP, pick an new name – and then note down the IP
  • run this to create the firewall rule (this can be done similarly on Cloud Platform Console) – where 8080 is the default port for Zeppelin
gcloud compute firewall-rules create zeppelin \
--source-ranges 0.0.0.0/0 --allow tcp:8080 \
--target-tags master

(see open-gce-firewall)

Then in any browser, type this for address:
http://‹master-node-external-IP›:8080

Spark

What’s new in SparkR 1.6.0

Thanks to community contributions we have a ton of changes in SparkR since Spark 1.5.2.

For details, refer to the SparkR Programming Guide and SparkR API documentation.

Here we are trying to highlight SparkR specific changes and there are more in Spark overall. For more details please refer to the release note.

New additions

New operations for DataFrame:

subset, transform, sd/stddev, cov/corr, arrange (aka sort), freqItems, column, sampleBy, attach/with, coltypes, colnames
collect (unicode string, Array, Map, Struct), as.data.frame
as.DataFrame

Updated operations for DataFrame:

join – new join types
sample – seed parameter
collect – support raw type, nested array/complex type

New column functions:

Windowing functions – cume_dist, lag, lead, ntile, dense_rank, percent_rank, rank, row_number
Agg functions – sd/var, kurtosis, skewness
collection functions – array_contains, sort_array
string functions – decode, encode
Other functions – struct, corr, is.nan

Updated column functions:

default for approxCountDistinct rsd value

Updated data access API:

read.parquet, read.json + support vector of paths
write.parquet, write.json

Updated MLlib API:

New R formula support – feature interactions
glm – solver algorithm, standardize parameter
summary – return coefficients instead of weights, more stats for LinearRegressionModel

Updated SparkContext programmatic initialization sparkR.init():

Support setting Spark driver properties
Support vector for sparkJars and sparkPackages parameters

Updated YARN support:

Package and ship SparkR package when in YARN cluster mode

Lastly, various bug fixes, several tooling/test updates, new code example, and a number of improvements in the Programming Guide and API documentation.

Breaking changes

DataFrame operations: merge – new parameters (more R-like, breaking function signature change)
column functions: isNaN is replaced by is.nan
write.* functions: default save mode to error

NA handling: In Spark 1.6.0, NAs in R are converted to Nulls in Spark SQL automatically. This is a change from the previous release. To illustrate, please see the following example:

> head(rock_na)
    area     peri     shape   perm
1   4990 2791.900 0.0903296    6.3
2   7002 3892.600 0.1486220    6.3
3   7558       NA 0.1833120    6.3
4   7352 3869.320 0.1170630    6.3
> df <- as.DataFrame(sqlContext, rock_na)
> head(df)
  area    peri     shape perm
1 4990 2791.90 0.0903296  6.3
2 7002 3892.60 0.1486220  6.3
3 7558      NA 0.1833120  6.3
4 7352 3869.32 0.1170630  6.3
5 7943 3948.54 0.1224170 17.1
6 7979 4010.15 0.1670450 17.1

> a <- filter(df, "isnull(peri)")
> head(a)
  area peri    shape perm
1 7558   NA 0.183312  6.3
> a <- filter(df, "isnotnull(peri)")
> head(a)
  area    peri     shape perm
1 4990 2791.90 0.0903296  6.3
2 7002 3892.60 0.1486220  6.3
3 7352 3869.32 0.1170630  6.3
4 7943 3948.54 0.1224170 17.1
5 7979 4010.15 0.1670450 17.1
6 9333 4345.75 0.1896510 17.1
> a <- filter(df, "peri IS NULL")
> head(a)
  area peri    shape perm
1 7558   NA 0.183312  6.3

For the full list of changes:
https://issues.apache.org/jira/secure/ReleaseNote.jspa?version=12333083&projectId=12315420

operational

Status page with Cachet on Docker and EC2

Cachet seems to be one of the better open source status page solution with nice visuals and powerful REST APIs.

Cachet works very nicely and easily on Docker. Below are the steps to set it up on EC2.

EC2 Preparation

Remember to log out and back in after setting permission!

Getting Cachet on Docker

From the command

$ docker run -d --name cachet --link mysql:mysql -p 80:8000 -e DB_HOST=mysql -e DB_DATABASE=$DB_DATABASE -e DB_USERNAME=$DB_USERNAME -e DB_PASSWORD=$DB_PASSWORD cachethq/cachet:latest

Notice that this command by default setup port mapping to 80 – you should make sure the proper security policy is set in EC2 to allow remote access

Setting up Cachet

Cachet has a nice setup wizard, simply open your EC2 {instance IP} on a browser – you should be redirected to the setup page. On that page choose database for driver and then complete the rest of the setup steps.

To come back to configuration, when the page is opened, go down and find the dashboard button and sign in for more options.
To get API key, click the logo on top left and profile.

REST with Cachet

Create component
curl -H "Content-Type: application/json;" -H "X-Cachet-Token: YOUR_TOKEN" -d '{"name":"My component","description":"description of the component, it supports *markdown*","status":1}' http:// {instance IP}/api/v1/components
Create metrics for component
curl -H "Content-Type: application/json;" -H "X-Cachet-Token: YOUR_TOKEN" -d '{"name":"Queue length","description":"queue length","suffix":" items (this is the unit, notice the prefix space)","default_value":"0","display_chart":1}' http:// {instance IP}/api/v1/metrics

Return JSON result like this

{"data":{"name":"Queue length","display_chart":"1","default_value":"0","calc_type":0,"description":"queue length","suffix":" items","updated_at":"2015-06-23 23:19:19","created_at":"2015-06-23 23:19:19","id":1}}

Notice id:1 for the created metrics

Post metrics data point

We will reference the metrics with id 1; set timestamp to UNIX Epoch time.

curl -H "Content-Type: application/json;" -H "X-Cachet-Token: YOUR_TOKEN" -d '{"value":30,"timestamp":1435089600}' http:// {instance IP}/api/v1/metrics/1/points

curl -H "Content-Type: application/json;" -H "X-Cachet-Token: YOUR_TOKEN" -d '{"value":45,"timestamp":1435093380}' http:// {instance IP}/api/v1/metrics/1/points

Lastly you can your metrics here http:// {instance IP}/dashboard/metrics
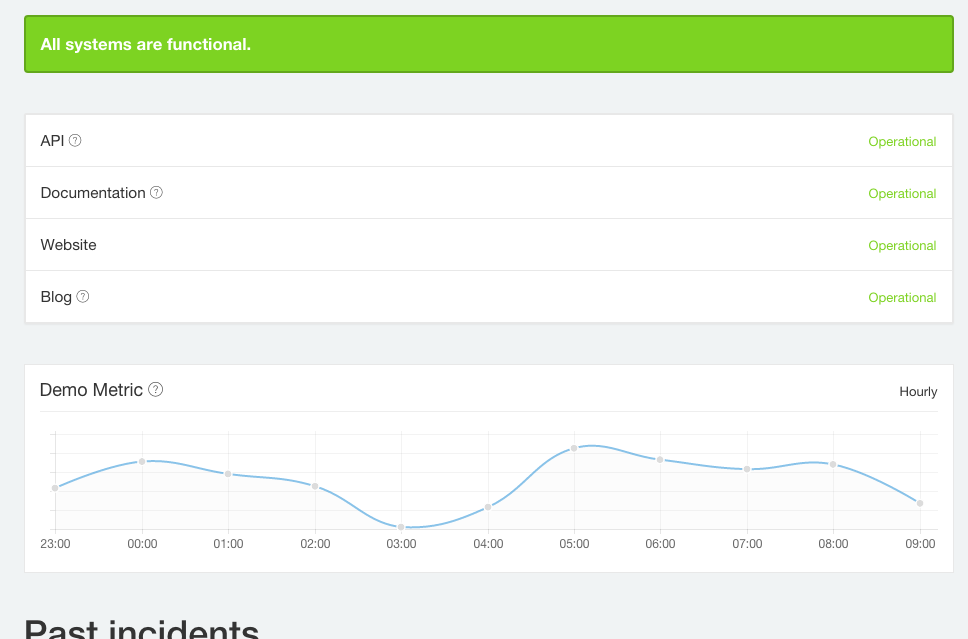
And change how the posted data points are represented, either as Sum (ie. Add all reported data points within the time range) or Average

Metrics

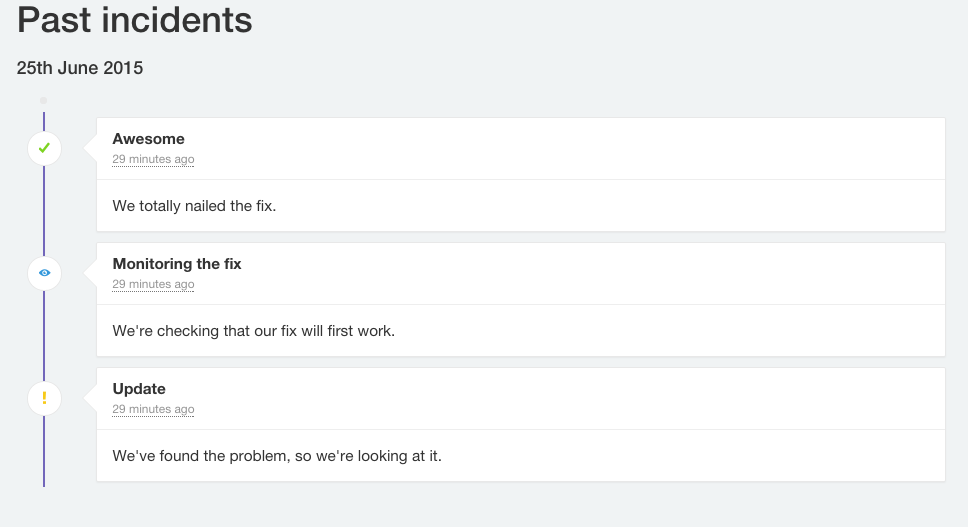
Incidents

Spark

Synonyms fun with Spark Word2Vec

Spark MLlib implements the Skip-gram approach of Word2Vec. With Skip-gram we want to predict a window of words given a single word.

This is part of the work I have done with PySpark on IPython notebook.

from pyspark.mllib.feature import Word2Vec
textpath = '/user/fcheung/text8_linessmall'
inp = sc.textFile(textpath).map(lambda row: row.split(" "))

word2vec = Word2Vec()
model = word2vec.fit(inp)
synonyms = model.findSynonyms('car', 40)
for word, cosine_distance in synonyms:
  print "{}: {}".format(word, cosine_distance)

This outputs:

        driver: 0.717452287674
        accident: 0.540586173534
        pilot: 0.534710288048
        cable: 0.533736109734
        flying: 0.524660527706
        marlin: 0.52224111557
        slim: 0.515641212463
        revolver: 0.512815892696
        launched: 0.512356519699
        serie: 0.511943757534
        racing: 0.507736027241

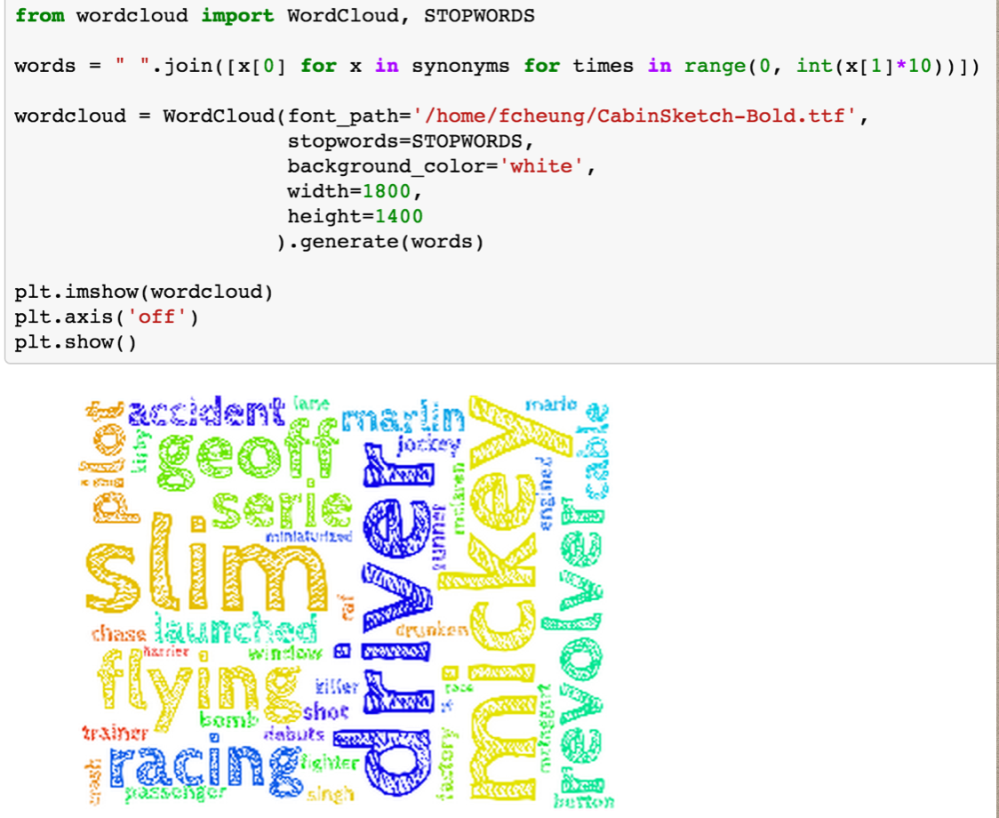
And then to visualize it, with matplotlib and the WordCloud package

%matplotlib inline
import matplotlib.pyplot as plt
from wordcloud import WordCloud, STOPWORDS

words = " ".join([x[0] for x in synonyms for times in range(0, int(x[1]*10))])

wordcloud = WordCloud(font_path='/home/fcheung/CabinSketch-Bold.ttf'
                            stopwords=STOPWORDS
                            background_color='white'
                            width=1800
                            height=1400
                           ).generate(words)
plt.imshow(wordcloud)
plt.axis('off')
plt.show()

WordCloud is expecting a document to analyze. Since we have already done the analysis, this code fakes the document by inserting each word in the number of times as their cosine distance from Word2Vec.

word2vec in wordcloud

For more information and actual IPython notebook file, please see my github repo

Spark

Using Spark packages to parse csv

Environment: Spark 1.3.0

To start,

$ ./spark-shell --packages com.databricks:spark-csv_2.10:1.0.2

This leverages Spark’s new package support – it will automatically download and install the given package into your local repo.

To use this it is very simple via the Data Sources API,

import org.apache.spark.sql.SQLContext
val sqlContext = new SQLContext(sc)
val df = sqlContext.load("com.databricks.spark.csv", Map("path" -> "/Users/fcheung/Data/kddcupl", "header" -> "true"))
df.printSchema

Spark-csv package:
– Handles header
– Use header to set schema, specifically column names

For more information check out the github page for spark-csv

df: org.apache.spark.sql.DataFrame = [duration: string, protocol_type: string, service: string, flag: string, src_bytes: string, dst_bytes: string, land: string, wrong_fragment: string, urgent: string, hot: string, num_failed_logins: string, logged_in: string, num_compromised: string, root_shell: string, su_attempted: string, num_root: string, num_file_creations: string, num_shells: string, num_access_files: string, num_outbound_cmds: string, is_host_login: string, is_guest_login: string, count: string, srv_count: string, serror_rate: string, srv_serror_rate: string, rerror_rate: string, srv_rerror_rate: string, same_srv_rate: string, diff_srv_rate: string, srv_diff_host_rate: string, dst_host_count: string, dst_host_srv_count: string, dst_host_same_srv_rate: string, dst_host_diff_srv_r...

root
 |-- duration: string (nullable = true)
 |-- protocol_type: string (nullable = true)
 |-- service: string (nullable = true)
 |-- flag: string (nullable = true)
 |-- src_bytes: string (nullable = true)
 |-- dst_bytes: string (nullable = true)
 |-- land: string (nullable = true)
 |-- wrong_fragment: string (nullable = true)
 |-- urgent: string (nullable = true)
 |-- hot: string (nullable = true)
 |-- num_failed_logins: string (nullable = true)
 |-- logged_in: string (nullable = true)
 |-- num_compromised: string (nullable = true)
 |-- root_shell: string (nullable = true)
 |-- su_attempted: string (nullable = true)
 |-- num_root: string (nullable = true)
 |-- num_file_creations: string (nullable = true)
 |-- num_shells: string (nullable = true)
 |-- num_access_files: string (nullable = true)
 |-- num_outbound_cmds: string (nullable = true)
 |-- is_host_login: string (nullable = true)
 |-- is_guest_login: string (nullable = true)
 |-- count: string (nullable = true)
 |-- srv_count: string (nullable = true)
 |-- serror_rate: string (nullable = true)
 |-- srv_serror_rate: string (nullable = true)
 |-- rerror_rate: string (nullable = true)
 |-- srv_rerror_rate: string (nullable = true)
 |-- same_srv_rate: string (nullable = true)
 |-- diff_srv_rate: string (nullable = true)
 |-- srv_diff_host_rate: string (nullable = true)
 |-- dst_host_count: string (nullable = true)
 |-- dst_host_srv_count: string (nullable = true)
 |-- dst_host_same_srv_rate: string (nullable = true)
 |-- dst_host_diff_srv_rate: string (nullable = true)
 |-- dst_host_same_src_port_rate: string (nullable = true)
 |-- dst_host_srv_diff_host_rate: string (nullable = true)
 |-- dst_host_serror_rate: string (nullable = true)
 |-- dst_host_srv_serror_rate: string (nullable = true)
 |-- dst_host_rerror_rate: string (nullable = true)
 |-- dst_host_srv_rerror_rate: string (nullable = true)
 |-- label: string (nullable = true)

After that you can query the DataFrame

df.groupBy($"label").count().orderBy($"count".desc).take(10)
Spark

Using Spark Data Sources to load data from PostgreSQL

Environment: PostgreSQL 9.3 running on another host
This host is running CentOS 6.5 and Spark 1.3.0

Good starting point: http://spark.apache.org/docs/latest/sql-programming-guide.html#jdbc-to-other-databases

On the Spark-host,

$ rpm -Uvh http://yum.postgresql.org/9.3/redhat/rhel-6-x86_64/pgdg-centos93-9.3-1.noarch.rpm
$ yum install -y postgresql93-jdbc
$ ls /usr/share/java/postgresql93-jdbc.jar

Go to Postgres-host to get Postgres to accept remote connection, modify
/etc/postgresql/9.3/main/postgresql.conf

find
listen_addresses = 'localhost'
Change to->
listen_addresses = '*'

/etc/postgresql/9.3/main/pg_hba.conf
host all all 127.0.0.1/32
Change to->
# IPv4 local connections:
host all all samenet md5

These changes will allow client connections, specifically Client Authentication, within the same subnet.

(if you don’t: org.postgresql.util.PSQLException: FATAL: no pg_hba.conf entry for host “1.1.1.1”, user “x”, database “postgres”, SSL off)

then restart

$ /etc/init.d/postgresql restart

Before you start, make sure the user account has password, etc.

More information on Postgres JDBC: https://jdbc.postgresql.org/documentation/93/connect.html
Very handy summary on the expected JDBC URL format: http://www.petefreitag.com/articles/jdbc_urls/

Now on Spark-host, assuming SPARK_HOME is in PATH, run Spark Shell with the JDBC jar

$ spark-shell --driver-class-path /usr/share/java/postgresql93-jdbc.jar

Then you can execute this to create the Spark Data Frame:

val jdbcDF = sqlContext.load("jdbc", Map(
  "url" -> "jdbc:postgresql://postgreshost/postgres?user=username&password=userpassword",
  "dbtable" -> "tablename"))

You will want to update these in the above code:
postgreshost – IP or hostname for your Postgres-host
username
userpassword
tablename

For example,

scala> val jdbcDF = sqlContext.load("jdbc", Map(
     |   "url" -> "jdbc:postgresql://lgn/postgres?user=vagrant&password=1234",
     |   "dbtable" -> "users"))
jdbcDF: org.apache.spark.sql.DataFrame = [id: int, created_at: timestamp, updated_at: timestamp, email: string, encrypted_password: string, reset_password_token: string, reset_password_sent_at: timestamp, remember_created_at: timestamp, sign_in_count: int, current_sign_in_at: timestamp, last_sign_in_at: timestamp, current_sign_in_ip: string, last_sign_in_ip: string, provider: string, uid: string, name: string, admin: boolean]

scala> jdbcDF.take(10)
res0: Array[org.apache.spark.sql.Row] = Array([1,2014-05-27 22:44:17.416732,2014-05-27 22:44:17.416732,user@gmail.com,$2a$10$4p0qIxaxUznMb5L2DpMlMeuQmEesXnsJaHSfnqWWdLWMAfNFGxOU6,null,null,null,0,null,null,null,null,null,null,User Name,true])

scala> jdbcDF.registerTempTable("users")

scala> sqlContext.sql("SELECT * FROM users WHERE email LIKE '%gmail.com'").collect
res1: Array[org.apache.spark.sql.Row] = Array([1,2014-05-27 22:44:17.416732,2014-05-27 22:44:17.416732,user@gmail.com,$2a$10$4p0qIxaxUznMb5L2DpMlMeuQmEesXnsJaHSfnqWWdLWMAfNFGxOU6,null,null,null,0,null,null,null,null,null,null,User Name,true])

scala> sqlContext.sql("""
   CREATE TEMPORARY TABLE usersTable
   USING org.apache.spark.sql.jdbc
   OPTIONS (
     url "jdbc:postgresql://lgn/postgres?user=vagrant&password=1234",
     dbtable "users"
   )""")
res0: org.apache.spark.sql.DataFrame = []

scala> sqlContext.sql("SELECT * from usersTable limit 1").collect
res3: Array[org.apache.spark.sql.Row] = Array([1,2014-05-27 22:44:17.416732,2014-05-27 22:44:17.416732,user@gmail.com,$2a$10$4p0qIxaxUznMb5L2DpMlMeuQmEesXnsJaHSfnqWWdLWMAfNFGxOU6,null,null,null,0,null,null,null,null,null,null,User Name,true])
Uncategorized

Avoid stale data in Impala, force it to reload every day

We have a bunch of nightly ETL workloads. Problem is every morning our users are getting stale data because while Hive does the ETL, Impala is not aware of it. After getting some help, I wrote this script to be ran by Oozie every morning:

#!/bin/bash

# need to set PYTHON EGG path
# need to CONNECT if not running on datanode with impalad

PYTHON_EGG_CACHE=./localeggs /usr/bin/impala-shell -q "set SYNC_DDL=true; invalidate metadata;"

This executes the INVALIDATE METADATA command and get Impala to reload data and metadata changes (eg. New tables)

Kudo to this for the good starting point

Here has more context on using Hive with Impala.